What is Root Cause Analysis: Definition, Examples & Methods
RCA (Root Cause Analysis) is a basic problem-solving method applied in software testing and quality assurance to determine the root cause of defects, failures, and process inefficiencies. This is vital for organizations that want to improve their software quality, reduce the same issues, and improve entire engineering efficiency.
While this is an important exercise, not all QA teams successfully implement RCA in the right way. When RCA is poorly executed, we get superficial fixes, repeated failures (the same failures), and a high cost of quality. In this article, we will understand the principles of RCA, best practices, methodologies, and practical case studies to make sure RCA is implemented correctly.
What is Root Cause Analysis?
Root Cause Analysis, or RCA in short, is a systematic process that helps to identify the fundamental cause of a problem. RCA helps to identify the cause of the problem rather than addressing its symptoms. This will help implement correcting and preventive actions (CAPA), thereby eliminating recurring defects in application development.
Every area of the industry, like software development, quality assurance (QA), manufacturing, healthcare, and IT operations, uses the RCA technique to enhance problem-solving, improve processes, and reduce risks.
Importance of Root Cause Analysis
It’s important because good root cause analysis allows stakeholders to find the actual root cause of a problem and fix things rather than just treating the symptoms to keep things flowing. Let’s look at the key benefits of RCA.
- Prevents Recurrence: By discovering the root cause and fixing it, Root Cause Analysis prevents the recurrence of the same problem over time for a longer period of stability.
- Improves Efficiency: By resolving the source of the problem rather than providing a temporary solution for the symptoms, RCA prevents having to troubleshoot the same problem repeatedly. Thus saving time and increasing overall efficiency.
- Enhances Quality: Resolving fundamental issues leads to products and services being more effective and processes being safer and more dependable for the end user.
- Reduces Costs: Addressing the root cause of the problem at an early stage avoids increased expenses that eventually lead to rework, system malfunctions, and resource wastage, resulting in overall cost savings.
- Strengthens Compliance: RCA supports compliance with industry standards and regulatory requirements by providing systematic resolution of underlying issues. This helps in reducing risks within security, safety, and legal compliance.
Root Cause Analysis Steps

The RCA process is a structured approach that helps to identify the root cause of the problem and eliminate the cause, thereby eliminating its recurrence. Let’s see how to do the Root Cause Analysis.
Step 1: Define the Problem
The first step is to define the problem. This includes:
- Identifying the issue: What went wrong?
- Understanding the scope: Who is affected, and how severe is the impact?
- Gathering evidence: Collect logs, reports, screenshots, and user complaints.
- Documenting the problem statement: Ensure it is clear and objective.
Example:
- Issue: Users cannot log in to the application.
- Impact: 70% of customers report authentication failures.
- Scope: Mobile and web applications affected.
Step 2: Collect and Analyze Data
In the next step, we will collect and analyze the relevant data. Actions performed in this step include:
- Check system logs: Identify timestamps and error codes.
- Examine past occurrences: Has this issue happened before?
- Interview stakeholders: Get input from developers, testers, and users.
- Use monitoring tools: Analyze system performance and network activity.
Example:
- Data collected: 500 failed login attempts in the last 24 hours.
- Observation: Errors originated from the authentication service.
Step 3: Identify Potential Causes
In this step, we will brainstorm to figure out all the possible reasons for the issue. Actions involved in this step are:
- Use brainstorming sessions involving multiple teams.
- Categorize potential causes into People, Process, Technology, and Environment.
- Apply cause-and-effect analysis to map relationships between symptoms and causes.
- Potential causes:
- Database connection failures
- Incorrect password encryption method
- Third-party authentication service outage
- Expired security tokens
Step 4: Determine the Root Cause
Now, it’s time to pinpoint the real root cause. To do that, we can use structured RCA techniques. Many techniques are available, and we will discuss them in detail later in this article. To list a few:
- The “5 Whys” Method: Asking “Why?” repeatedly until the root cause is found.
- Fishbone (Ishikawa) Diagram: Categorizing causes for better visualization.
- Fault Tree Analysis (FTA): Breaking down causes in a structured tree format.
Example (5 Whys):
- Why did users fail to log in? → Authentication service rejected tokens.
- Why did it reject tokens? → Tokens were expired prematurely.
- Why were tokens expiring early? → Session timeout was set to 5 minutes instead of 30.
- Why was the session timeout incorrect? → A configuration file was modified in the last deployment.
- Why was the configuration changed? → A new security policy was implemented without proper testing.
Step 5: Develop a Corrective Action Plan
Once the root cause is identified, the next step is to create an action plan to correct the issue so that it won’t occur again.
- Short-term fix: Immediate workaround to mitigate the problem.
- Long-term fix: Permanent solution to prevent a recurrence.
- Assign ownership: Define responsibilities for implementing solutions.
- Set deadlines: Ensure timely execution of fixes.
Example:
- Immediate Fix: Revert session timeout to 30 minutes.
- Long-term Fix: Implement automated validation for configuration changes.
- Ownership: The DevOps team will update deployment procedures.
- Timeline: Fix to be tested and deployed in 24 hours.
Step 6: Implement the Solution
Once the corrective plan is finalized, it’s time to implement the solution with minimal disruption.
- Test changes in a controlled environment before production deployment.
- Monitor system behavior to confirm that the issue is resolved.
- Communicate updates to stakeholders and end-users.
Example:
- Fix applied in the test environment.
- QA team validates login functionality.
- Deploy fixes to production during off-peak hours.
Step 7: Validate and Monitor
Make sure that the problem does not reoccur by monitoring the system post-implementation.
- Track key performance indicators (KPIs): Error rates, system uptime, and user complaints.
- Conduct follow-up reviews to identify potential risks.
- Document RCA findings for future reference.
Example:
- Authentication failures were reduced to 0.1%.
- Regular audits are implemented for session timeout settings.
- RCA report archived for future learning.
Step 8: Document & Improve Processes
In this stage, all the lessons learned will be captured, and process improvements will be implemented.
- Findings from RCA analysis
- Steps taken to resolve the issue
- Process improvements to prevent recurrence
- Training requirements for the team
Example:
- Findings: The missing index issue happened due to a lack of schema validation before deployment.
- Process Improvement: Introduce an automated database validation tool in CI/CD pipelines.
- Lessons Learned: Teams must follow pre-deployment schema validation to prevent similar failures.
Summary of RCA Process
| Steps | Actions |
|---|---|
| Define the Problem | Identify what happened, when, and its impact. |
| Collect Data | Gather logs, user reports, and system metrics. |
| Identify Potential Causes | Brainstorm possible reasons for the issue. |
| Determine the Root Cause | Use RCA techniques to pinpoint the fundamental cause. |
| Develop a Corrective Action Plan | Create short-term and long-term fixes. |
| Implement the Solution | Apply and test the corrective actions. |
| Validate and Monitor | Make sure the issue is resolved and prevent recurrence. |
| Document & Improve Processes | Record lessons learned, optimize workflow |
RCA Methodologies: Examples of Cause and Effect
There are different methodologies and frameworks to assist teams in performing RCA properly. These checklists are designed for various problems and industries and they provide a structured, data-driven process to solve problems.
The 5 Whys Method

This is a simple yet powerful method used for RCA analysis. This method originated from Toyota’s production system in the 1950s, which was developed by Sakichi Toyoda. This method is mainly adopted in lean manufacturing, Six Sigma, software development, and quality assurance.
The fundamental idea is that by asking “Why?” typically five times. This iterative questioning helps drill down from the symptoms of a problem to its underlying cause, allowing teams to implement long-term solutions rather than just treating surface-level symptoms.
Let’s see this in action:
- Define the Problem: Begin by clearly stating the issue you need to resolve. This could range from a software bug, a process inefficiency, or a recurring failure in your system. Clearly defining the problem ensures the investigation is focused and effective.
- Ask “Why?” for the First Time: Once the problem is identified, ask, “Why did this happen?” The initial answer will usually describe a direct cause but may not yet reveal the root cause. It’s the first step in uncovering the sequence of events that led to the issue.
- Dig Deeper with Another “Why?”: Using the answer from the first “Why,” ask again, “Why did that happen?” This step moves beyond the surface-level issue and begins identifying underlying weaknesses in the system or process.
- Continue Asking “Why?” Until You Find the Root Cause: Repeat this process multiple times, typically five, until you uncover the fundamental cause of the problem. Some problems may require fewer than five questions, while more complex issues might need more.
- Implement a Long-Term Fix: Once the root cause is identified, address the problem at its source instead of just fixing symptoms. This ensures that the issue does not recur, leading to more efficient, reliable, and sustainable solutions.
Now, let’s see an example.
- Problem: Website crashes frequently.
- Why? → The database server overloads.
- Why? → Too many queries are sent at once.
- Why? → The API doesn’t have a rate limit.
- Why? → Rate-limiting was never implemented.
- Why? → It was not part of the initial design requirements.
Fishbone Diagram (Ishikawa Diagram)

There are different names for this method like Fishbone Diagram, Ishikawa Diagram or Cause-and-Effect Diagram. This is a visual method which helps the team to identify the different causes of a problem by organizing them into categories.
The diagram resembles a fishbone, with the problem at the head and potential causes branching out like fish bones. It is commonly used in manufacturing, quality assurance, process improvement, and software development.
Let’s see the steps to create an Ishikawa diagram.
Step 1: Identify the Problem
- Clearly define the issue you are analyzing.
- Place it at the head of the fishbone diagram.
- Example: “Software application crashes frequently.”
Step 2: Identify Major Cause Categories
- Draw a horizontal line from the problem statement and add main categories branching out like a fish skeleton.
- Common categories (for different industries) include:
- Manufacturing: Materials, Machines, Methods, Manpower, Environment, Measurement.
- Software Development & QA: People, Process, Technology, Tools, Environment, Data.
Step 3: Brainstorm Possible Causes
- Under each category, list potential contributing factors.
- Example for “Software Crashes”:
- People → Lack of developer training, coding errors.
- Process → Poor testing strategy, no CI/CD pipeline.
- Technology → Unoptimized database queries, memory leaks.
- Tools → Outdated software libraries and inefficient debugging tools.
- Environment → Server overload, compatibility issues.
- Data → Corrupt data inputs, excessive API calls.
Step 4: Analyze and Prioritize Root Causes
- Identify the most likely or significant root causes.
- Use data, past issues, or testing results to validate assumptions.
Step 5: Develop Solutions and Implement Fixes
- Once the root causes are found, create an action plan to fix the problem at its source.
- Example: If crashes are caused by unoptimized database queries, implement indexing or caching solutions.
Fault Tree Analysis (FTA)
Fault Tree Analysis (FTA) is a top-down deductive approach to identify the root causes of system failures by mapping out potential faults in a logical diagram. It allows teams to see the way various failures can lead to a catastrophic failure of a larger system.
Although FTA was originally developed for the aerospace and nuclear industries in the 1960s, today it is widely used in engineering, software development, cybersecurity, risk assessment, and quality assurance. FTA starts with a top-level failure (undesirable event) and breaks it down into contributing faults, using Boolean logic (AND, OR gates) to show relationships between causes.
Let’s look at the step-by-step process of creating an FTA.
- Define the Top-Level Failure: Start by identifying the main system failure or undesired event you want to analyze. This failure should be clearly defined and placed at the top of the fault tree. Example: “Website crashes under peak load.”
- Identify Immediate Causes: Determine the direct causes that could lead to the top-level failure. These could be hardware failures, software bugs, process issues, or human errors. Place them as branches below the top-level event.
- Break Down Each Cause Further: For each immediate cause, identify deeper contributing factors that might trigger it. Keep asking, “What could cause this issue?” until you reach root causes such as faulty code, system misconfigurations, or missing safeguards.
- Use Logic Gates (AND/OR) to Show Relationships: Decide how different causes contribute to the failure using Boolean logic gates:
- AND Gate: The failure occurs only if all listed causes happen together.
- OR Gate: The failure occurs if any of the listed causes occur.
- Analyze and Identify Critical Failure Points: Once the tree is complete, analyze weak points to determine which failures have the highest impact on the system. Use historical data, simulations, or expert judgment to prioritize risks.
- Implement Preventive Actions: Based on the analysis, develop solutions to eliminate or reduce the likelihood of failures. This could include adding redundancies, improving monitoring, training teams, or fixing software bugs. The goal is to reduce risk and prevent recurrence.
Pareto Analysis (80/20 Rule)

According to this 80/20 Rule, 80% of effect is derived from 20% of causes and Pareto Analysis is a decision-making technique based on this Rule. This process is useful for identifying the most important contributors to a problem and prioritizing actions to resolve them.
It is used in business, quality control, software testing, customer care, and process enhancement to identify the smallest number of variables that have the most useful results. Consider a traffic jam. 80% of the traffic jam will be created by 20% of the vehicles. If we clear those 20%, the traffic jam will get cleared.
Let’s see the steps for Pareto Analysis.
- Identify the Problem: Clearly define the main issue you want to analyze. This could be software defects, customer complaints, system failures, or inefficiencies in a business process.
- List All Contributing Factors: Identify all possible causes or factors contributing to the problem. Gather data from logs, reports, customer feedback, or error-tracking systems.
- Collect Data and Measure Frequency: Quantify how often each cause occurs using real data. Count the number of occurrences, defects, errors, or complaints linked to each factor.
- Sort Causes by Impact: Arrange the causes in descending order based on their frequency or impact. The highest contributors should be at the top, as they have the most influence on the problem.
- Calculate the Cumulative Percentage: Convert the frequencies into percentages and compute a cumulative total to determine the impact of each factor.
- Create a Pareto Chart: A Pareto Chart is a bar graph that visually represents the frequency of each cause. The left Y-axis represents the frequency of occurrences, while the right Y-axis represents the cumulative percentage. The most impactful issues appear first.
- Focus on the Most Significant Causes: Using the 80/20 Rule, address the top 20% of causes, which account for 80% of the problem.
Failure Mode and Effects Analysis (FMEA)
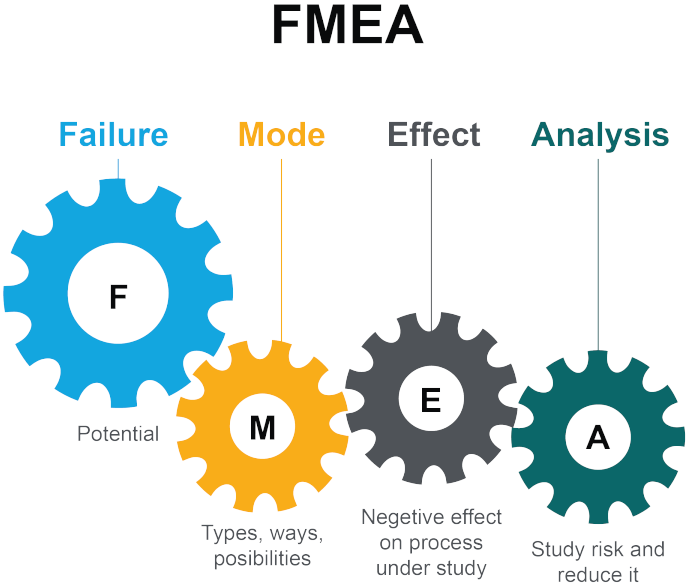
FMEA (Failure Mode and Effects Analysis) is a structured, preventative approach for identifying potential failure modes of a service, product, or process before they occur. It assists teams in identifying risks, prioritizing failure modes, and taking preventive actions to increase reliability and quality.
FMEA is widely applied across manufacturing, aerospace, automotive, software engineering, healthcare, and QA for minimizing the risks and thus optimizing performance. Let’s see how we can perform FEMA.
-
Identify the Process or Product to Analyze: Select the system, product, or process where potential failures need assessment. This could be a software feature, a manufacturing process, or a business workflow.Example: “Evaluate risks in an e-commerce checkout system.”
-
Identify Potential Failure Modes: List all the ways the system, product, or process could fail (failure modes). Failures can be functional, performance-related, or safety-critical.Example: In an e-commerce checkout system, potential failure modes might include payment gateway failure, incorrect order processing, or page timeout issues.
-
Determine the Effects of Each Failure: For each failure mode, describe the effects it would have on the system and users. Effects should be as detailed as possible.Example: If the payment gateway fails, customers cannot complete purchases, leading to loss of revenue and customer dissatisfaction.
- Assign Severity (S), Occurrence (O), and Detection (D) Ratings: Each failure mode is rated based on three key factors:
- Severity (S) → How serious is the effect of the failure? (Scale: 1-10, where 10 is catastrophic)
- Occurrence (O) → How frequently does this failure happen? (Scale: 1-10, where 10 is very frequent)
- Detection (D) → How easily can this failure be detected before it impacts users? (Scale: 1-10, where 10 means very difficult to detect)
Example:
| Failure Mode | Severity (S) | Occurrence (O) | Detection (D) |
|---|---|---|---|
| Payment Gateway Failure | 9 | 7 | 8 |
| Incorrect Order Processing | 8 | 6 | 5 |
| Page Timeout Issue | 6 | 5 | 4 |
-
Calculate the Risk Priority Number (RPN): Compute the Risk Priority Number (RPN) for each failure mode using the formula: RPN=SxOxDExample:Payment Gateway Failure: 9x7x8=504Incorrect Order Processing: 8x6x5=240Page Timeout Issue: 6x5x4=120
-
Prioritize and Implement Preventive Actions: Focus on failure modes with the highest RPN and take corrective actions to reduce risks. Actions can include process changes, automation, monitoring improvements, or additional testing.Example: To reduce Payment Gateway Failure (RPN: 504), implement real-time monitoring, alternative payment methods, and automatic failover systems.
- Review and Continuously Improve: Regularly update the FMEA based on new data, system updates, and customer feedback. Make adjustments to improve reliability and minimize risks over time.
Root Cause Analysis Compared
| Technique | Purpose | Best For | Key Strengths | Limitations |
|---|---|---|---|---|
| 5 Whys | Identify the root cause | Simple, single-cause issues | Quick, easy to apply | May oversimplify complex problems |
| Fishbone Diagram | Categorize multiple causes | Problems with multiple factors | Great for brainstorming | Does not prioritize causes |
| Fault Tree Analysis (FTA) | Map failure logic | Complex system failures | Highly structured, logical | Can be complex for large systems |
| Pareto Analysis (80/20 Rule) | Prioritize high-impact causes | Frequent defects, inefficiencies | Focuses on critical issues | Does not find root cause |
| FMEA | Prevent failures before they happen | Risk prevention in processes | Proactive, prioritizes risks | Requires detailed data & expert input |
Which Technique Should You Use?
- For a quick root cause analysis → Use 5 Whys
- For brainstorming multiple causes of a problem → Use Fishbone Diagram
- For analyzing complex system failures → Use Fault Tree Analysis (FTA)
- For prioritizing the most significant issues → Use Pareto Analysis (80/20 Rule)
- For proactively identifying and preventing risks → Use Failure Mode and Effects Analysis (FMEA)
Each method has its strengths and is often used together for a comprehensive problem-solving approach. For example:
- Use Pareto Analysis to identify high-impact defects, then apply FMEA to prevent failures.
- Use 5 Whys to find the root cause, then create a Fishbone Diagram to explore related issues.
- Use Fault Tree Analysis for critical system failures, then apply FMEA to implement preventive measures.
Root Cause Analysis Tools
Various tools are available that can help you easily perform a Root Cause Analysis (RCA). Let’s explore some of the commonly used software solutions that have RCA techniques integrated:
- Excel: A versatile tool often employed for collecting, analyzing, and visualizing data; it is often used to construct Pareto charts, scatter diagrams, and control charts to inspect for trends and identify possible root causes.
- Lucidchart: A cloud-based diagramming platform perfect for Fishbone Diagrams, flowcharts, and process mapping that lets teams visualize and analyze internal reviews to identify cause-and-effect relationships.
- SonarQube: A static code analysis tool that scans codebases for inputs that may represent underlying defects, security weaknesses, and performance bottlenecks; SonarQube helps developers and security teams to find and fix a set of bug patterns that otherwise go undetected.
- Minitab: A statistical analysis tool that aids in data-driven RCA as it allows teams to generate Pareto charts, histograms and regression analyses for compressing large data sets to determine root causes.
- FaultTree+: A specialized tool for Fault Tree Analysis (FTA), this software helps teams generate failure scenarios and perform risk analysis for systems, processes, or products.
- QlikView / Tableau: Advanced data visualization and analytics tools that enable teams to analyze big data, recognize trends, and unearth correlations that may be helping to drive repeat issues.
- TapRooT: A root cause analysis software with structured methods that allow you to use existing templates and checklists to help you run 5 Whys, Fishbone Diagrams, and incident analysis.
- Microsoft Visio: A diagramming tool that is used to create Fishbone Diagrams, process flowcharts, and cause-effect visualizations so you can use it to structure the RCA investigations.
Best Practices for Effective RCA
- Adopt a Blameless Culture: Discuss which process failed, not who failed the process, and create an open discussion and continuous improvement.
- Use Data-Driven Decision Making: Utilize qualitative and quantitative data to help confirm, validate, and trace facts of root cause.
- Leverage Automation for RCA: Use AI-powered tools, automatic monitoring, and log analysis to help detect patterns at rapid speed, thus also making root cause investigations more efficient.
- Collaborate Across Teams: Involve developers, QA engineers, product managers, and DevOps teams for a broader perspective and more efficiency in solving problems.
- Document RCA Reports: Keep structured records of what worked, what did not, what caused the problem, and what are the resolution(s). Document it so this will act as knowledge for future processes.
Common RCA Roadblocks
Though RCA is very structured and process oriented, there are many limitations in implementing RCA effectively. Let’s look into those reasons.
- Superficial Analysis: The teams only identify higher-level causes instead of the real root cause, and the cycle continues with the old problems still persisting and poorly implemented fixes.
- Lack of Ownership: Without ownership, it becomes exceedingly difficult to solve the root cause of the issues, leading to the same problems occurring over and over again.
- Confirmation Bias: Teams want to be right, and that leads them to conclusions drawn from assumptions instead of objectively analyzing data, which leads to errors in root-cause determination.
- Time Constraints: RCA is frequently done in a hurry due to tight deadlines and enforced solutions, which does not enable a thorough investigation and often results in incomplete or ineffective solutions.
- Inadequate Data Collection: Insufficient or incorrect data may lead to wrong analysis, therefore making it nearly impossible to determine the actual underlying cause of the problem.
- Resistance to Change: Teams might hesitate to adapt to necessary process changes, fearing the extra work needed to implement new changes or being unwilling to change their process.
- Complexity of Issues: Complex issues have more than one interdependent cause, which makes it difficult to discover a single root cause without an elaborate inquiry.
- Poor Documentation: Unorganized RCA reports make knowledge retention difficult; teams cannot learn from earlier problems and prevent reoccurrence.
Conclusion
RCA is a robust solution that, when performed accurately, improves software quality & avoids returning defects. When this is done correctly, including using structured methodologies, automating where appropriate, and promoting a culture of continuous improvement, organizations properly divert their energy and effort toward driving quality improvement from RCAs.
Getting RCA done is aided by discipline, collaboration, and a focus on root-cause solutions rather than bandaids — all of which are hard to do. QA teams that perfect RCA will be able to construct robust, quality software with fewer expensive errors.